Impact of Road-Space-Rationing Method on Regional Air Quality
SummaryFollowing the implementation of the Delhi Governments policy of Road-Space-Rationing (Odd-Even) method, the Amity University Haryana (AUH), Panchgaon-Manesar-Gurgaon monitored, from the day one, its efficacy by making systematic high resolution particulate matter (PM1, PM2.5 and PM10) and spectral variation of black carbon (BC) aerosol mass concentration measurements in conjunction with concurrent solar and local meteorological measurements in its campus. These measurements revealed a significant reduction in the pollution levels on implementation of the odd-even scheme. It was found that due to overlapping of some prominent meteorological phenomena like western disturbances (WDs); fogs etc., inherent to the tropical winters, the results were found to be unclear on the days when the sky was not clear. However, the trends were found to be promising and encouraging. The Government has decided to repeat the policy, in a phased manner, during the forthcoming summer and post-monsoon seasons with more advance preparedness. Thus, the policy shows promising results and it is hoped that this useful exercise would bring down the vehicular pollution and associated health hazards to a considerable extent. Added, considering this experiment conducted in the Delhi region as a model, many other States in the Nation are planning to implement similar policy in their regions.
IntroductionPollution in many Indian cities, Delhi in particular, is rapidly increasing and significantly hazarding the economy and health of population (Ex. Dockery et al., 2005; Balakrishnan et al., 2012). It is known that pollution is highly dynamic and exhibits tremendous space-time variations; and pollution levels over urban areas can be estimated only when the relative levels over any background area (high-altitude or rural) are known (Devara, 1998). Studies have indicated excess mortality (and morbidity) in Delhi due to cardiovascular/cardiopulmonary and respiratory causes, based upon occupational related acute exposures of pathogens (microorganisms) alone (Goodel and Rando, 2015).
Furthermore, additional factors such as variance in solar radiation, toxicity of atmospheric and biogenic emissions, and wind-blown dust and soil, all result in exacerbation of the issue (CPCB, 2011). In order to curb these anthropogenic emissions, and to develop cost-effective methods for health improvements (especially pre-mature deaths), Government of Delhi had recently implemented an odd-even formula (Road Space Rationing). While the debate on the success of this initiative may continue, what cannot be denied is the fact that with the reduction of vehicles on road, the total pollution load during the stretch of twelve hours (08:00am to 08:00pm) has come down by at least a factor of two. This is primarily because of subsequent reduction in traffic congestion resulting in considerable reduction in commuting time. This directly relates to about 50% reduction in the fuel consumption for the same distance traveled on odd-even days. This is by no means an improvement both from the point of view of commuters and human health, and also from the point view of air quality and fuel economy.
Experimentation, Results and Discussion
The experimental station, Panchgaon (28.31oN, 76.90oE, 285 m above mean sea level), Haryana State, is a rural location, situated around 50 km from Delhi. This site is surrounded, in the north-east direction, by two cities, namely, Gurgaon (~ 24 km) and Manesar (~9.5 km) which possess several small- and large-scale industries, the study site receives pollution whenever the wind blows in the north-east sector. It is about 5 km away from the Delhi-Jaipur National Highway (NH8) in the north-east (NE) direction, and is surrounded by vegetation and enveloped by vegetation Aravalli hillocks of average elevation of about 200 m (Devara et al., 2014).
High-resolution Black Carbon (BC) and Particulate Matter (PM1, PM2.5 and PM10) mass concentration have been carried out employing the Air Quality Monitoring Facility established at Amity University Haryana (AUH), Panchgaon-Manesar-Gurgaon from 29 December 2015 to 20 January 2016, encompassing the Road-Space-Rationing (Odd-Even) method implemented by the Delhi Government for reducing air pollution in the Delhi region. The daily marching of these air quality drivers is portrayed in figures from 1 through 5 below.
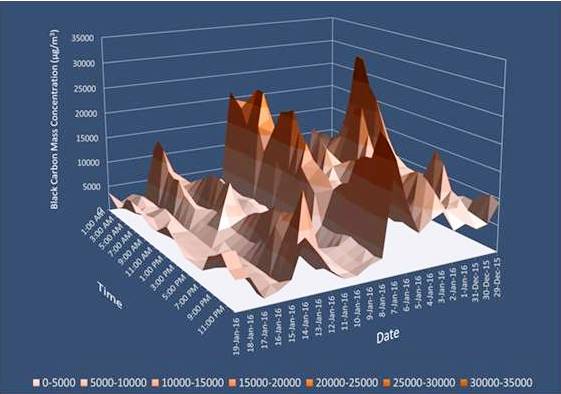
Fig. 1: 3-dimensional view of date-wise diurnal variation of BC mass concentration observed over AUH during the study period. Bi-modal distribution with significant enhancement in BC concentration during 6th-8th January 2016, peaking on 7th, due to FOG may be noted.
The time-concentration cross-sections of BC mass variation, observed with Magee Scientific-make 7-wavelength Aethalometer during the study period, are shown plotted in Figure 1. One can clearly visualize the hour-by-hour variation of BC mass and its association with local meteorology, from commencement of the mass concentration for the entire study period, and the solid line in black color passing through it denotes best fit line, depicting the decreasing trend. Program i.e. 29 December 2015 through 20 January 2016 over AUH, Panchgaon. It may also be interesting to see here that the BC values are lower under clear-sky and higher under foggy conditions due to the reasons explained in the paragraphs to follow. Further, it may be noted that the daily mean mass concentration of the black carbon also shows drastic reduction at AUH monitoring station from 15 micrograms per cubic meter on 31 January 2015 (before commencement of the initiative) to approximately 1.4 micrograms per cubic meter on 11th January 2016. Figure 2 displays the daily diurnal variation in BC mass concentration during the study period. The common feature that is observed on all the days that BC mass concentration depicts bi-modal distribution with primary peak around 0800 h and secondary peak around 2000 h, both may primarily be due to the transport activities in and around the study region. The black carbon mass concentration was higher on 31 December 2015, and thereafter, it showed gradual decrease during fair weather conditions on remaining days. The minimum blackcarbon concentration observed on each day around noon hours is ascribed to the local planetary boundary layer (PBL) height variations.
