The day-to-day variation in BC mass concentration during the study period is shown plotted in Figure 3. Higher concentration during the turbid-sky conditions and less concentration during the clear-sky conditions may be noted. Figure 4 portrays the diurnal variation of PM1, PM2.5, PM10 and Figure 5 displays the daily mean mass concentrations of PM2.5 and PM10 recorded with TSI-make Aerodynamic Particle Sizer (APS) over AUH, Panchgaon. It is glaringly seen that PM10 concentrations dominate as compared to PM1.0 and PM2.5 concentrations. The higher PM10 concentrations are attributed to dust outbreak in and around the experimental site, whenever wind speeds are strong. It may be noted that the observed PM2.5 concentrations over Panchgaon are over four times lower than that of concentrations over urban Delhi. PM2.5, being particulate matter which adversely affects the health and PM10 concentrations influences the earth-atmosphere radiation balance vis-à-vis local short-term climate changes.
The daily diurnal mean mass concentration values of PM1, PM2.5, PM10 and BC are presented in Table 1. It is interesting to note that PM2.5 mass concentration is four times lower than that of urban Delhi. Likewise, the major PM10 concentration at Amity University Haryana is also less than half of what is reported from urban Delhi. It may be noted here that both PM and BC variations are highly influenced by the meteorological phenomena (associated bidirectional feedbacks on air pollutants) such as Western Disturbances (WDs) and Fog. The high wind speeds associated with WD (and long-range transport) remove pollutants, resulting in low concentrations in the study region. At the same time, these winds also may bring fresh particles from the surrounding regions and make the study region rich in concentration.
On the other hand, fog (associated with low temperature) situations generally enhance the pollution levels due to secondary aerosol (new particle) formations, growth of exist-sting particles (depending on composition) and local boundary-layer dynamics. Therefore, the fluctuations in mass concentration during such complex meteorological situations should be treated with caution.
Figure 6 displays day-to-day spectral variations in column-integrated aerosol optical depth (AOD), Ozone (TCO) and Precipitable Water Content (PWC). These observations are representative of atmospheric extinction (attenuation) up to stratospheric altitudes (~50 km).
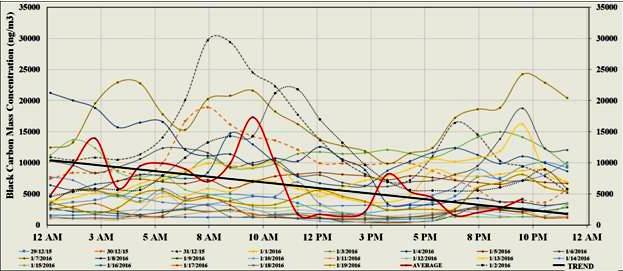
Fig. 2: Diurnal variation of BC mass concentration on different observation days over AUH, Panchgaon-Manesar-Gurgaon. The thick curve in red color indicates mean diurnal variation of BC
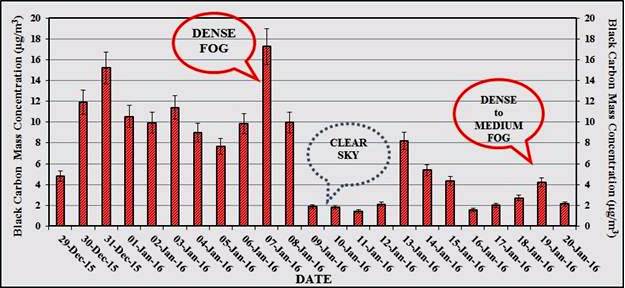
Fig. 3: Day-to-day variation in BC mass concentration during 29 December 2015 20 January 2016.
