3. Satellite-based estimation of PM2.5 distribution over India
3.1 Satellite-based PM2.5 measurementRecent global burden of disease study (e.g.) pointed out ambient air pollution is one of the leading causes of mortality in the Indian subcontinent. In this region, particulate matter is one of the major criteria pollutants. Particles smaller than 2.5 µm (PM2.5) can reach our alveoli; hence they are considered as very good indicator for health impact assessments (WHO, 2006). Epidemiological studies examining the impacts of PM2.5 on human health depends on robust statistics of PM2.5 concentration at various spatial and temporal scales (e.g. Anenberg et al., 2010). Unfortunately, such long-term measurements are not available in India under the ground-based network maintained by Central Pollution Control Board. Moreover, mostly these in-situ measurements are confined to urban regions, thereby overlooking large semi-urban and rural population.
To address this critical issue, satellite data were analyzed to estimate surface PM2.5 concentration over India for the period 2000-2010. Multiangle Imaging Spectro Radiometer (MISR), onboard NASA EOS-Terra satellite retrieves columnar aerosol optical depth (AOD) routinely since Mar 2000 at 17.6 km resolution. The quality of MISR-AOD retrieval has been discussed in the literature (Kahn et al., 2010; Dey and Di Girolamo, 2010). The method used a conversion factor (η) to convert the columnar AOD to surface PM2.5. η has been derived from a chemical transport model (van Donkelaar et al., 2010). The model utilized the emission inventory to estimate 3-D aerosol distribution based on the synoptic meteorology, where the vertical distribution is constrained by CALIPSO-derived aerosol profiles and columnar AOD by satellite-retrieved AOD.
Thus η is a function of emission and meteorology (the two factors that influence the aerosol distribution) and not just the regression coefficient between AOD and PM2.5. Furthermore, the utility of this η lies in the fact that the chemical transport model does not need to be operated every time; rather it can be simply used to convert satellite-retrieved AOD to surface PM2.5 at any site.
The PM2.5 concentration derived by the above method was validated against the coincident in-situ observations. The under-estimation in the satellite-based estimates of PM2.5 with respect to in-situ observations is mostly attributed to two factors (i) under-estimation in MISR-retrieved AOD relative to ground-based measurements in India (Dey and Di Girolamo, 2010) and (ii) model uncertainty. Further detailed analysis (as documented in Dey et al., 2012) revealed that the error in this new method is linear and a bias correction
was applied to the entire dataset. Bias-corrected satellite-based PM2.5 showed much improved correlation with in-situ data. Space-time distribution of PM2.5 over the Indian subcontinent was examined using the bias-corrected dataset.
3.2 PM2.5 Distributions and Health Implications
Decadal statistics of satellite-based PM2.5 revealed that the mean annual concentration exceeds World Health Organization standard of 10 μg m-3 over 70% (49% of the inhabited area) of the region, where 83% of the total 1.4 billion population lives (Fig. 1a). This enormous pollution is not only observed in the urban areas, but also observed in the semi-urban and rural areas. Further analysis focusing on 46 major urban areas (where population exceeds 1 million) revealed that the PM2.5 concentration is higher than the Indian standard (60 μg m-3) in 18 urban areas. These cities are (in decreasing order of mean annual concentration)
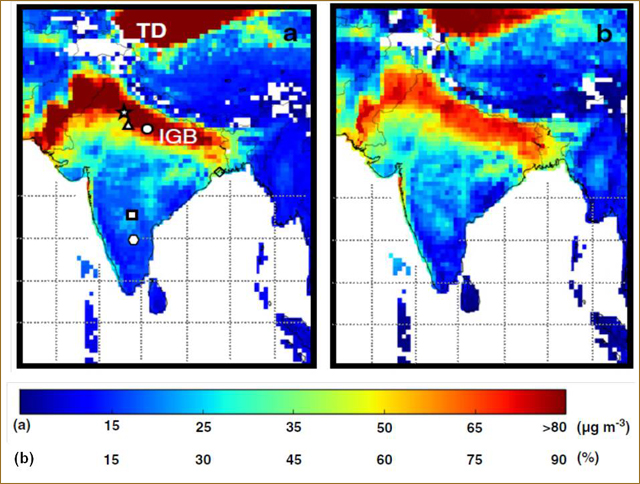
Fig. 1 Spatial distribution of (a) mean annual PM2.5 as estimated from satellite-based bias-corrected datasets and (b) frequency occurrences of daily PM2.5 exceeding WHO Interim target 3 (37.5 µg m-3) in a year. The figure is adopted from Dey et al. (2012).
